Monday, July 23, 2007

New GIS Certificate underway at AB Tech

Interested in how you can use GIS to better do your job or just wondering what all the buzz is about? Asheville-Buncombe Technical Community College is now offering a 4-course certificate in GIS. The current course offerings can be seen below.

GIS 111 - Introduction to GIS
GIS 121 - Georeferencing and Mapping
GIS 215 - GIS Data Models
and one of the following other courses:
CIS 110 - Computer concepts
CIS 115 - Introduction to Programming and logic or
DBA 110 - Database Concepts

AB Tech is taking a unique approach to teaching Geospatial Technology by offering classes in the Computer Information Technology Department. This approach will allow GIS, GPS and other related technologies to be taught in the broader context of information systems while capitalizing on existing programs and certificates already at the college in Web Technologies, Database Technologies, and Interactive Multimedia. This certificate provides a strong foundation in Geospatial Technologies with more classes planned in the Database, Web and Multimedia programs.

Come take GIS from ESRI Authorized Instructors and Trimble Certified Trainers at AB Tech!

See the fall schedule of GIS classes below -


For more information.... see our blog below


or you could always call, email or stop by with any questions!
pkennedy (at) abtech.edu
828.254.1921 x289

Monday, July 2, 2007

Hawth's Tools

So this is probably not new and exciting to everyone else, but I recently ran across the Hawth's Analysis Tool Set available at http://www.spatialecology.com/. This is an extremely useful set of tools for anyone doing any type of ecology work with ArcMap as it expands Arc's functionality in this area.

So far the features that I have found most useful and the biggest time savers are the ability to generate random points and the ability to create evenly spaced grid shapefiles. It also has other features which I have yet to exploit including animal movement simulation.

Perhaps the most attractive part of this tool is that it is completely free and it easily installs and integrates with the Arc products. Please don't let me limited review deter you, this is definitely something worth checking out.

Thursday, June 28, 2007

JAVA / GIS Contract job

Hi all,

I had someone inquire about a good JAVA programmer with some GIS experience for a 3 month contract job. I thought I would post it here to see if there is any interest. Please pass along to anyone you can think of that may be able to do this kind of work. This is the kind of work that would be great to keep in our local pool of talent without having to outsource.

Java Programmer With GIS Experience

Lab Escape is looking for an experienced Java programmer with GIS experience to add geographic mapping capabilities into our visual analysis software. Experience with GeoTools is a plus. This is a contract position for 3 months. Development firms with relevant experience may apply. If interested, please contact Trevor Lohrbeer at resumes@labescape.com.

Sunday, June 3, 2007

The May 30th WNCGIS Gathering


The May Gathering at Dirty Jacks in downtown Asheville was another fun time for everyone in our GIS community. We got a chance to look at the maps for the Map Contest, and everyone put in a vote for their favorite. Although all the maps were very nice, I'm pleased to announce that the ever-industrious Josh O'Conner had the most votes. He won a coveted Malaprops Gift Certificate. To the left you can see him proudly displaying his prize.

A Big "Thank You" goes out to everyone who participated in the Map Contest. We hope that we will continue to get support and entries for the contest, so that we can select a winner or two bi-monthly. As you may recall, having a theme of some kind for each contest cycle was one idea, so if anyone would like to see a particular theme for the next contest, let us know.

Friday, June 1, 2007

CommunityViz

I thought I would post some information on the CommunityViz software package and some of its more useful features. The package functions as an extension for the ArcGIS products. It allows for the creation of dynamic data that allows for scenarios to be created in a sort of "What if?" analysis.

I have just been toying with it a little over a week and I intend to use to construct some data correlating Hemlock die back with stream temperature increases. The program seems to be primarily designed to use in community planning operations but can be extended for more ecological centered uses.

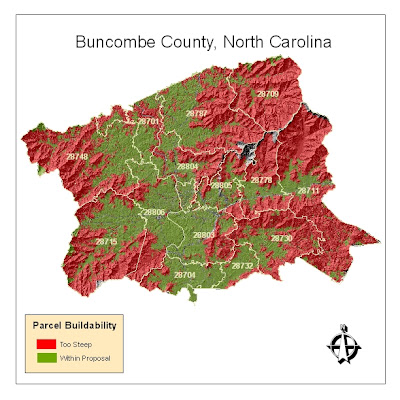
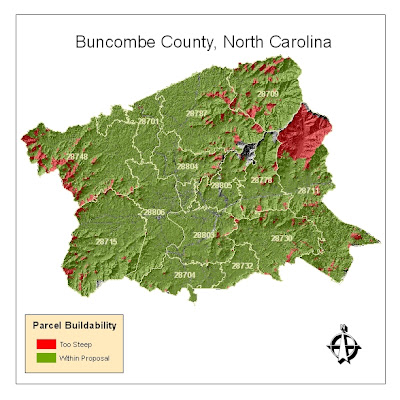
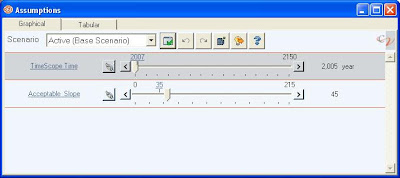
In order to learn the basics of the program I began toying around with average parcel slope data in Buncombe county. I then set a dynamic threshold on allowable slope percentage within the parcels (so that it would be easy to understand the volume of parcels that would be affected by various limitations on development in sloped areas). The first map is set with a maximum allowable slope of somewhere around 20% (yes, low, I know). Using the slider bar with the variable constructed in CommunityViz, the map can be updated dynamically to show what would happen should an ordinance be proposed that barred development on in parcels with slopes that are greater than 45%.


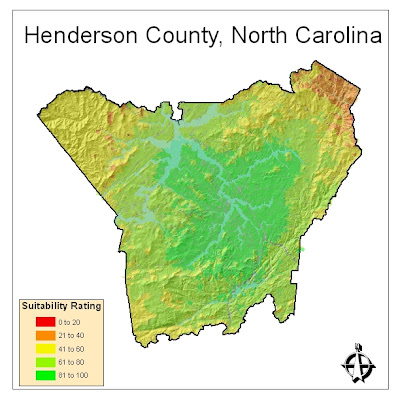
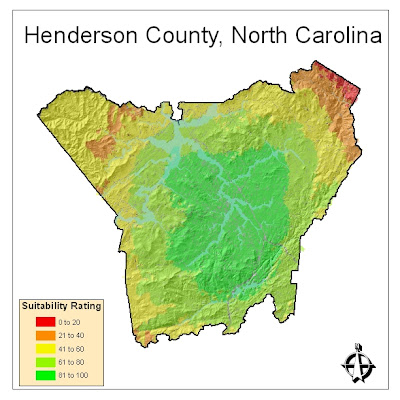
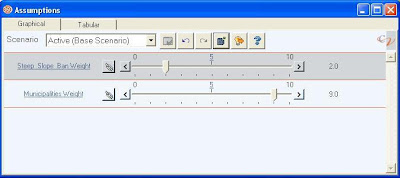
In order to understand how CommunityViz could perform with weighing two variables within a single map I constructed a similar analysis that factored in parcel slope and distance to a city. Say in case a developer was looking for a location to build a retirement community and wanted to select land that wouldn't be too steep, thus deterring older occupants; at the same time this developer would want to build within reasonable proximity to the cities of Flat Rock or Hendersonville because of their notoriety among retirees. The first map shows both factors with equal weight. The second shows what would occur if the developer became less concerned with parcel slope but really wanted to cash in on people heading toward Flat Rock or Hendersonville.


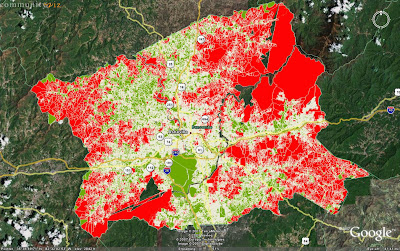
One last feature worth noting is the seamless integration with the Google Earth platform. Following the analysis of the Buncombe County slopes, I exported the data to Google Earth so that it could be made accessible to a wider user base (this is with the data with maximum slope set at 20%).


Clicking on the thumbnails will yield better pictures and I will post more as I play with the program more.

Saturday, May 5, 2007

Pix from the April 26th WNC GIS Beer Meeting


Our meeting on April 26th was a lot of fun, and we chose a random winner for the Trivia Contest. Gene was the lucky winner and he was presented with a brand-new copy of the acclaimed book The Ghost Map. Here you can see Gene (with Jason) to his left) joyfully opening the book's wrapping. The other photo of the whole group captured most of the people who turned out at the Asheville Brewing Company. Thanks to everyone who joined us!

Tuesday, May 1, 2007

Focus Group Needed

So as a continuation of my first post... I am in need of some assistance on the Campus Mapping project I am working on. After having it reviewed by members of the UNCA campus community, I realize that it is in need of review by people that aren't as emotionally attached to certain aspects of the campus or particular viewing perspective. If anyone could do me a huge favor and take a look at the map and give me their feedback I would greatly appreciate it. I am open to any suggestions at all. This particular map is a print map for first time visitors to the campus and maybe a tool to some of the students who may not be familiar with more obscure buildings.

Here's the link. The map images are on the left and you can click on them to enlarge them to print-size.

Thanks.
My e-mail is JoshDOTOConnerATgmailDOTcom (substitute appropriate symbols for bold text)