I have just been toying with it a little over a week and I intend to use to construct some data correlating Hemlock die back with stream temperature increases. The program seems to be primarily designed to use in community planning operations but can be extended for more ecological centered uses.
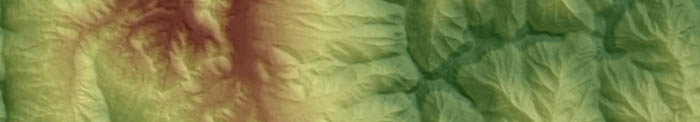
In order to learn the basics of the program I began toying around with average parcel slope data in Buncombe county. I then set a dynamic threshold on allowable slope percentage within the parcels (so that it would be easy to understand the volume of parcels that would be affected by various limitations on development in sloped areas). The first map is set with a maximum allowable slope of somewhere around 20% (yes, low, I know). Using the slider bar with the variable constructed in CommunityViz, the map can be updated dynamically to show what would happen should an ordinance be proposed that barred development on in parcels with slopes that are greater than 45%.


In order to understand how CommunityViz could perform with weighing two variables within a single map I constructed a similar analysis that factored in parcel slope and distance to a city. Say in case a developer was looking for a location to build a retirement community and wanted to select land that wouldn't be too steep, thus deterring older occupants; at the same time this developer would want to build within reasonable proximity to the cities of Flat Rock or Hendersonville because of their notoriety among retirees. The first map shows both factors with equal weight. The second shows what would occur if the developer became less concerned with parcel slope but really wanted to cash in on people heading toward Flat Rock or Hendersonville.


One last feature worth noting is the seamless integration with the Google Earth platform. Following the analysis of the Buncombe County slopes, I exported the data to Google Earth so that it could be made accessible to a wider user base (this is with the data with maximum slope set at 20%).

Clicking on the thumbnails will yield better pictures and I will post more as I play with the program more.

1 comment:
Looks like a really useful tool Josh, thanks for posting about it! I'm excited to check it out now.
Post a Comment